

Last Updated on August 29, 2026 by andrewjeffery4d8825d2ee
Contents
I last evaluated the Operational Dashboard after MAS 9.0 had been released in September 2024, two years ago. There were several enhancements in both MAS 9.1 and most recently in MAS 9.2 (June 2026) too much for one article. In this article I will focus on the changes made in MAS 9.1, however the screenshots are taken from a MAS 9.2 system.
The articles I previously wrote on the Operational Dashboard are still relevant:
Operational Dashboard MAS 8.11 – https://maximosecrets.com/2024/03/01/operational-dashboard/
Operational Dashboard MAS 9.0 – https://maximosecrets.com/2024/09/23/operational-dashboard-mas-9-0/
I also published both a video script and a podcast script, but I never recorded either:
Operational Dashboard and Work Queues – Video Script – https://maximosecrets.com/2024/09/26/operational-dashboard-and-work-queues-2/
Operational Dashboard and Work Queues – Podcast Script – https://maximosecrets.com/2024/09/25/operational-dashboard-and-work-queues/
If you are completely new to Operational Dashboards and Work Queues you might look at the video script, it is the closest article I have to an overview. Perhaps later this year I might get around to updating it and recording it.
In this article and the next one for MAS 9.2 Operational Dashboard enhancements I’ll assume that the reader is relatively new to the Operational Dashboard. If you are looking to answer the question – Do the Operational Dashboards replace the Start Centers? – then I answered this in the article I wrote a few weeks ago – Operational Dashboard – MAS 9.2 Overview – https://maximosecrets.com/2026/08/03/operational-dashboard-mas-9-2-overview/
Preconfigured Dashboards

An Operational Dashboard has a set of cards. In the Emissions Management operational dashboard which you get if you have HSE installed (Health, Safety and Environment) there are four KPI Value cards along the top, a Favorites and Quick Action card, a KPI Comparison card and a Work Queue card. The Emissions Management operational dashboard was converted to appXML format in MAS 9.1, if you were using this in MAS 9.0 then any changes that you made to it will not be carried forward.
There are four Preconfigured Dashboards – Maintenance Management (in MAS 9.1 this was called Maintenance Manager), Emissions Management, Asset Management (in MAS 9.1 this was called Asset Manager), and Maintenance Costs. The Maintenance Costs operational dashboard was created to support the integration of IBM Apptio in MAS 9.1.
The Apptio integration uses five Object Structures starting APPTIO for exporting OrganizationsA structural element of a Maximo database which is used for data sharing. More, Sites, Locations, Assets and Work Orders. Each object structure has a Query Template that includes just the attributes needed for the export. There is an APPTIO End Point and Cron Task that also needs to be set up. CSV files for each export are created when the cron task instance runs. For work orders there is a setting in Organizations – Other Organizations Options – Work Order Status for export to Apptio – which can be set to Completed or Closed. There is a set of System Properties which is where Apptio keys are held and there is an inbound object structure that supplies a rest api for the data needed for the Maintenance Costs operational dashboard. The dashboard itself just provides a summary, but the detail will be found by launching into IBM Apptio where much deeper analysis can be made.
You’ll also find other operational dashboards like Defect Management if you have the Civil Infrastructure industry solution installed.

What operational dashboards you see is dependent on what you have installed and what operational dashboards have been granted in Security Groups and the Operational Dashboard tab. If you can’t see the four preconfigured ones then use the Select Dashboard Views button for a security group that you are a member of and select the ones you want to see, save and then log out and log in again.
I am logged in as WILSON who is a member of the MAXADMIN security group. The reason why I see the four operational dashboards shown previously is because in the MAXDEMO database WILSON created the dashboards and you can see the ones you created. If you logged in with a different user that is also a member of the MAXADMIN security group, for example REDDING, then no operational dashboards will be shown. This is because the default was changed in MAS 9.1 to not provide access to any preconfigured operational dashboards by default, they need to be granted through the Operational Dashboard tab in Security Groups (Manage) application.
I’ve raised an IBM Support case because these preconfigured dashboards should have been created by MAXADMIN instead of WILSON, that user is unlikely to exist on a client MAS system.
Quick Action card can apply a Ticket Template

The button to the right of the four preconfigured dashboards has options for Create Dashboard or Manage Dashboards. There are five signature options for the Operational Dashboard application, so if you do not see these it may be because you have not been granted privileges, this is changed in the Security Groups (Manage) application and the Applications tab, filter for Operational Dashboard. I’m going to create a new dashboard so that we can experiment with the MAS 9.1 enhancements to the operational dashboard.

The Create Dashboard dialog opens, and you need to provide a unique name, I’ve entered MAS91 and a description – MAS91-Enhancements. It will be created as a Public operational dashboard so that others can access it. If the Public checkbox is unchecked, it will be a Private operational dashboard which only you will be able to access. For others to be able to view a public dashboard they will need to be granted access through the Security Groups – Operational Dashboards tab.
The Default checkbox will make this the one that is displayed, currently it is Maintenance Management.

The operational dashboard MAS91 is now created, but it has no cards defined for it. The pencil button on the right is the option Edit Dashboard.

We have selected the Quick Actions card from the Card Gallery. Most if not all cards have a Basic tab and an Advanced tab. The Basic tab is similar for all cards, providing a Card Title, a Subtitle and Description (the purpose of the card) and the Card Width and Height setting, the default for a Quick Actions card is Extra small, Regular.

In the Advanced tab you can select the Quick Actions, which you need to do one at a time. I’m selecting Create Service Request which will launch the SR application.

A new feature in MAS 9.1 for the Quick Action card is that if the application is based on a ticket, then you can select a Ticket Template to apply. I’ve chosen SRD1003 – It’s too hot.

The four fields on the Advanced tab are now filled out. I’ve made the Name – Office too hot. It will launch the SR application and create a new Service Request and apply the Ticket Template SRD1003.

I’ve created a similar Quick Action for Office too cold and now I’m creating another called Emergency WO. This will create a new work order in the Work Order Tracking application the action WOTRACK. Notice for work orders there is no Template that can be applied. I did raise an IBM Idea to extend this card to be able to add a work order and apply a Job Plan, it looks as if it will be provided in MAS 9.3, but the status of the idea has not yet changed to Planned for Future Release – https://ibm-ai-apps.ideas.ibm.com/ideas/MASM-I-1497

When you have added the Quick Actions, you use the Save button, and you will receive the confirmation message – This dashboard will be viewable by all users. Do you want to save the dashboard with this setting?
The three Quick Actions all tested out OK.
KPI Value card can open a Work Queue
A KPI can now launch a work queue. The easiest way to demonstrate this is to start with a query in the application you would want to launch from the work queue, then create a KPI from the query and use the same query in the definition of a work queue.

In MAS 9.1 a new query was added to the Work Order Tracking application, and it is already used by a work queue. The Query is called WO_OWNED_BY_ME – Work Orders where I am owner, it retrieves four records where WILSON is the Owner.
As the query binds in the logged in user, it should only be used on a private operational dashboard and not a public one, you’ll see why in a second.
I am going to use the action Create KPI.

The Create KPI dialog converts the query into a KPI of the form – select count(*) from workorder, however in the Where clause it converts the bind field for :USER into the logged in user ‘WILSON’. The KPI is specific to WILSON, but the query (and work queue) can be used by whoever is logged in, hence it wouldn’t make sense for the KPI to be used by another user. If WINSTON used it, he would see the number of work orders that WILSON has, and then when he launches the work queue, he would see his own work orders, which might be a different number of records. This KPI should only be used on a private operational dashboard for WILSON.
When the Create KPI dialog opens you will need to provide a KPI Name (WILSON-WO), Description (Wilson Work Orders) and Target (3), Caution At (4) and Alert At (5) values.

On the MAS91 operational dashboard I have gone into Edit mode and added a KPI Value card which I have called Wilson Work Orders. In the Advanced tab you select the KPI – WILSON-WO and there is a new field added in MAS 9.1 – Linked Work Queue – I’ve selected the associated work queue to the Work Order Tracking query called – DEF MY WORK ORDERS.

When saved the overflow menu in the top right of the KPI Value card has options Open Work Queue, View in KPI Manager, View in KPI Viewer and Refresh, Open Work Queue is new to MAS 9.1.

We’ve used the Open Work Queue action and the work queue DEF MY WORK ORDERS is launched. A great enhancement to be able to launch a work queue and be able to see the records associated with a KPI, the Start Centers could not link a KPI to a Result Set.
KPIs can be sourced from External APIs

The KPI Manager application received a new section called Endpoint Details with two fields End Point and Expression. The external endpoint API must be of HTTP type that provides a JSON response.
{
“href”: “oslc/members/thisserver/memory”,
“heapMemory”: {
“commitedMemory”: 3072,
“initialMemory”: 3072,
“maxMemory”: 4096,
“usedMemory”: 539
},
“nonHeapMemory”: {
“commitedMemory”: 618,
“initialMemory”: 402,
“maxMemory”: 0,
“usedMemory”: 275
}
}
The expression of $.nonHeapMemory.usedMemory would provide a value of 275. See https://www.ibm.com/docs/en/maximo-manage/cd?topic=apis-kpi-enhancements
Work Queue card can show a single work queue

When you add a Work Queue card to an Operational Dashboard the default is to show Multiple Queues. Maximo will pull in all the active work queues that you have access to, the ones which do not have a Person Group attached and the ones where a Person Group is associated and you are a member of that person group. If you want the multiple work queues to show a specific set, for example those associated with assets then you need to delete the ones you do not want. However, there is a little trick, use the radio button to select Single Queue, this will clear the Work Queues list, then you can click back on the radio button Multiple Queues and use the Add (+) button to add the specific work queues.
The Multiple Work Queues format shows the Work Queue Name, Description, a Count of records that would be fetched by the work queue, and the Priority given to the work queue. You click on any work queue to see the actual records fetched by the query defined for the work queue.
Tip – Think about a naming convention for your Work Queues, by default the Select Value lookup shows the Work Queue Name and its Description and it does not display the Object Structure or Launch Application which are likely candidates for grouping work queues.

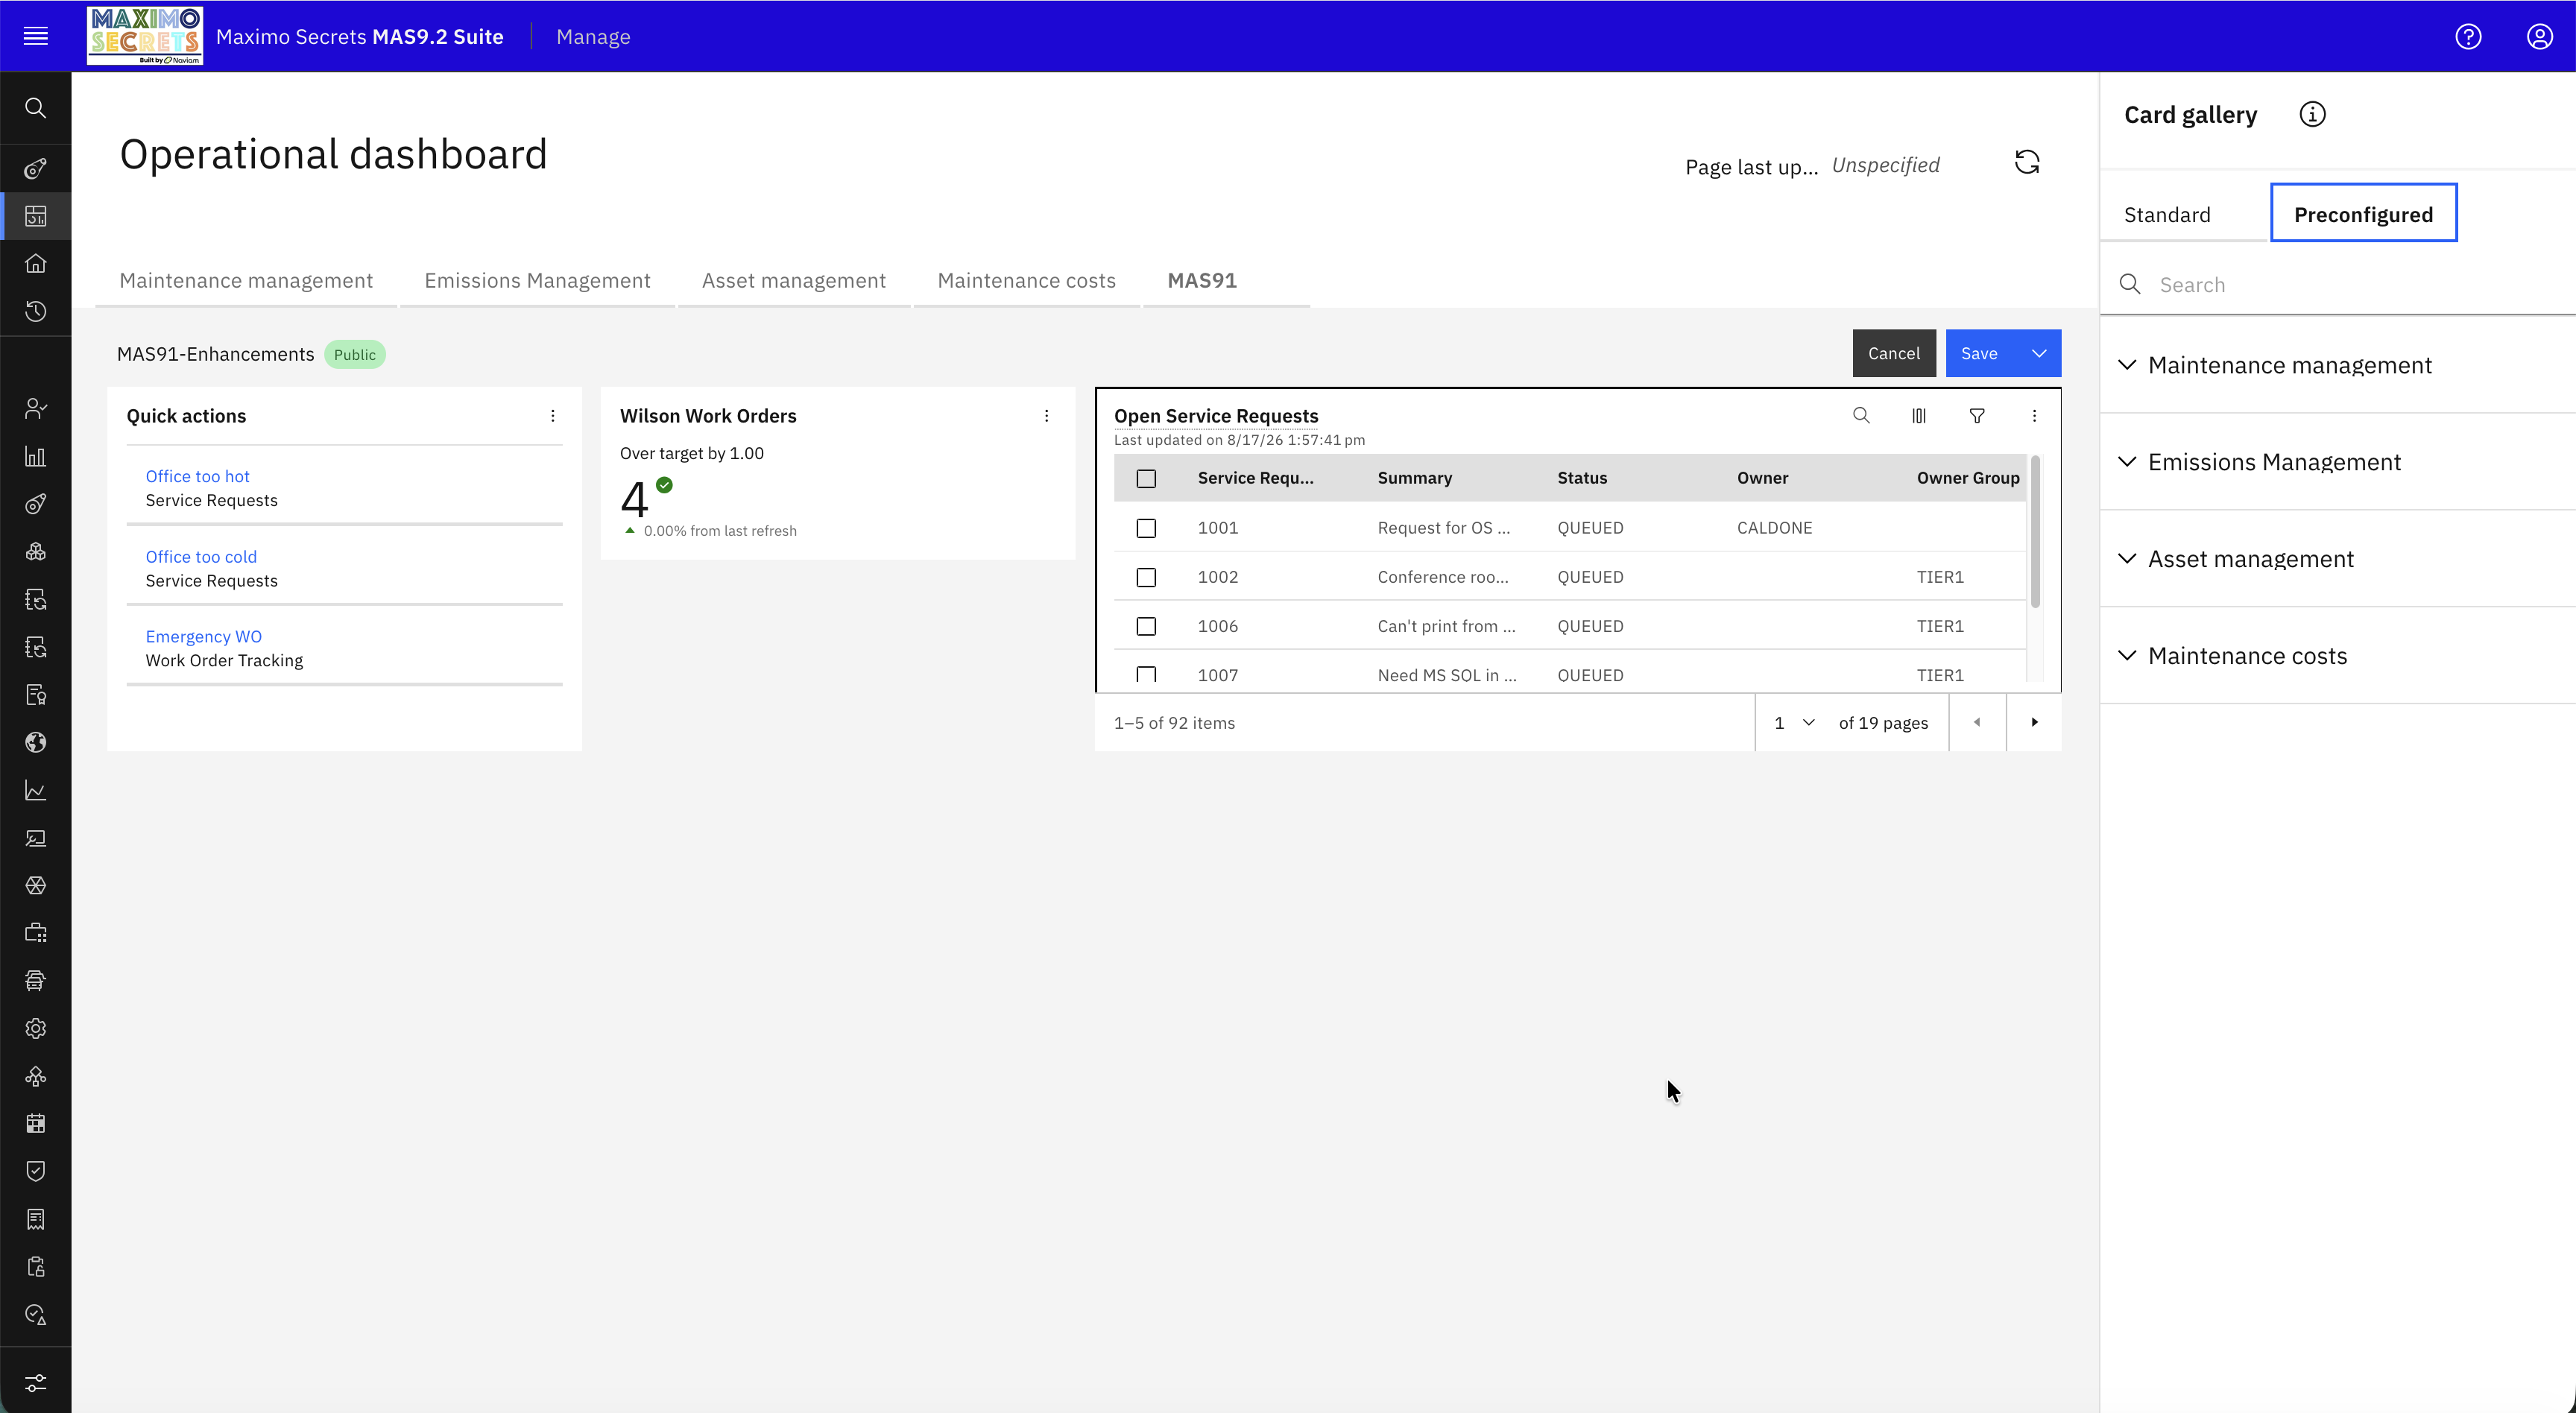
When you select the Single Queue option you can choose a Work Queue, I have chosen one based on open service requests (AJE02). On the Basic tab you would change the Card Title to something appropriate. The Table Columns shows the fields added to the work queue you can change the order or remove fields; you may have 10 or more fields defined for the work queue but in the operational dashboard you just need to show a few of these.
As I am using a MAS 9.2 system you will see a radio button with Table/List and Chart as options and then two tabs below for Table Setup and Chart Setup, the charting capability was added in MAS 9.2 which I will discuss in my next article.

The Single Work Queue will display the blue action bar when a record is selected in the left-hand column. When a record is highlighted, you can launch the associated application from the button on the right-hand side, but you cannot yet launch the application with the whole set of records as you can with a Start Center Result Set.

The Single Work Queue card has a toolbar with options Search, Manage Columns, Filter and the overflow button has the option to Expand the work queue.

The Expand option opens the Work Queue full screen. It has the same toolbar options of Search, Manage Columns and Filter but there are two more buttons for Reset Table Window and Download.
The Reset Table Window will reset the work queue columns, the left to right order of those columns, the filter and sort criteria, according to how they are defined by the Work Queue Manager application. Each user has a private view of a work queue. If you defined a work queue with just the TicketID and Description of the service request and then later added some additional columns, for example Status, Owner and OwnerGroup, then when the work queue card is rendered, you are likely to just see initially the TicketID and Description, you are looking at the personalised view. You need to use the Expand button and then use the Reset Table Window button to retrieve the latest set of columns and filter/sort criteria for the work queue. You are overwriting your private view of the work queue by that defined by the administrative user in the Work Queue Manager.

In the Work Queue Manager application for work queue AJE02 I’ve used the Add Members action and added a Person Group – TIER1. WILSON is not a member of the TIER1 person group. The existing Single Work Queue which was based on work queue AJE02 is still visible, this is because you are looking at a personalised view.
I’ve added another Work Queue Card with the Multiple Queues option, and you cannot select AJE02 because I am logged in as WILSON and I do not have access to this work queue. If I edited the Single Work Queue you would also find that work queue AJE02 is no longer selectable.
If you are an administrator using the Work Queue Manager, then I would initially create a new work queue without adding any Person Groups that would restrict who can select that work queue. If you are not a member of that person group, then you would not be able to select it and add it to an Operational Dashboard. You can always add the person groups afterwards. This feature of the Work Queue Manager is not providing security on who can fetch the data from a work queue, but it is restricting whether a user can select the work queue when they are configuring a Work Queue card on the Operational Dashboard.
Card Gallery shows the card type

The Card Gallery appears on the right-hand side panel when you are in Edit Mode of an Operational Dashboard. A small enhancement in MAS 9.1 was to add the name of the Card Type when you select a card to edit. In the screenshot I have selected the Open Service Requests card and in the top right it shows Card gallery / Work queues, you are editing a Work Queue card.
Card Gallery has a Preconfigured tab

The Card Gallery in MAS 9.1 now has two tabs Standard and Preconfigured. You won’t see the Gauge Tile or Map in a MAS 9.1 system; these were both added in MAS 9.2. Notice there is no Workflow card in the Standard list of cards.

The Preconfigured tab in the Card Gallery has the preconfigured operational dashboards that are installed, there are four on my system because I have Health and Health, Safety and Environment (HSE) installed on my system. You should at least find Maintenance Management and Maintenance Costs on a basic MAS Manage installation. If you have Civil Infrastructure installed, I believe you will see a new operational dashboard for MAS 9.1 called Defect Management.

If you open one of the operational dashboards in the Preconfigured tab, I’ve opened the one for Maintenance Management, then you will see all the cards that make up the preconfigured operational dashboard. If you scroll your eye down the card gallery you will see one for Workflow Assignments Due Soon.
You can use these preconfigured operational dashboards to see how the different types of cards have been used. You can also add them to another operational dashboard; we will do that for the Workflow card in the next section of this article.
Tip – Do not modify the preconfigured operational dashboards. You can duplicate one by editing it and instead of Save use Save As from the dropdown.

The screenshot above is the rendered Maintenance Management operational dashboard in MAS 9.2. In MAS 9.1 it was called Maintenance Manager, it didn’t have the Map or Bulletin Board cards which were both added in MAS 9.2.

If you are logging as another person other than WILSON who created these dashboards, then you may not see them. In Security Groups (Manage) they need to be granted in the Operational Dashboard tab to the Security Groups that need to see them.
I’ve added Maintenance Management to the users belonging to the SDMGR security group. You will also need to grant at least Read access to the Operational Dashboard in the Applications tab.
Workflow card can be copied from a Preconfigured dashboard

If you want to add a Workflow Assignments card to an Operational Dashboard then find it on the Preconfigured tab in the Card Gallery, it will be found under Maintenance Management. In earlier versions of the Operational Dashboard if you deleted the card, there was no way of being able to add it back again.

There is nothing to set up on the Advanced tab. The Workflow Assignments Due Soon is a preconfigured card using the Table card type as its base. If you go to edit this card on the Maintenance Management operational dashboard, you’ll find it has no Advanced settings.
If you have applications with an active workflow process, then your workflow assignments will appear in the card with title Workflow assignments due soon. I’ve enabled the POSTATUS workflow process and created a new PO, 1100 with a cost greater than 500 so that a workflow assignment is generated. You can navigate to the PO application and PO 1100 from the highlighted text; this will allow you to review the record assigned. If you select a workflow record you can then Route it or Reassign it. An example will be found at the bottom of this article – https://maximosecrets.com/2024/03/01/operational-dashboard/#workflow-card
Merger of Manage and Health Operational Dashboards and Work Queues
Prior to MAS 9.1 Health and Manage had their own work queues and dashboards, in MAS 9.1 these were merged.

In the Work Queue Manager search for relengineer and you’ll find seven work queues used by the Health operational dashboard. These can be added to the Work Queue card on any operational dashboard. If you are creating a new work queue that uses Health data use the MXAPIASSET Object Structure with the launch application of RELENGINEER, the new Assets and Locations application.

The Assets and Locations application was added in MAS 9.1 replacing what Health had previously. You create queries of assets and locationsA physical place where assets exist and where work can be performed. More and there are 39 provided as standard. There are seven work queues that use the same queries, for example the query HIGHPROBABLITYOFFAILURE is used by the work queue HIGH PROBABILITY OF FAILURE.
The Assets and Locations application can be added to the Favorites card on an operational dashboard.

The Asset Manager operational dashboard was added in MAS 9.1, it looked like this screenshot which is from the MAS 9.2 Asset Management operational dashboard, notice I have vertically scrolled down. The Asset Manager operational dashboard was added to complement the new Assets & Locations application.
In Security Groups (Manage) and the HEALTH security group you will find there are several operational dashboards that provide various aspects of the Assets & Locations application. You see these dashboards when you navigate into an asset or location.
Manage Private Dashboards option
This new capability allows an administrator to delete private dashboards.

In MAS 9.1 there is a new signature option – Manage Private Dashboards which you will find in the Security Groups (Manage) application – Applications tab, for the application called Operational Dashboard.

In the Operational Dashboard application there is an action Manage Dashboards and, in this dialog, there is a new blue button – Manage Private Dashboards.

The dialog opens and shows users who have private dashboards. You can delete all of their private dashboards in one action by using the Delete button or selecting multiple users and using the Delete action from the blue action bar that appears. Notice the (>) button on the right.
A user doesn’t see their own private dashboards in this dialog. A user can use the Manage Dashboards action to delete their own private dashboards.

The (>) button drills into the private dashboards created by the user and you can delete these individually, select the ones you wish to delete, again a blue action bar appears, or use the action Select All and then Delete.
If someone leaves your company, then this action allows you to delete their private dashboards. However, if they happen to have created public dashboards there still is no ability to change who created it, who effectively owns or is responsible for it.